Chart of the Day 8/13/25: Is it 1, 2, 3 Cuts Ahead at the Fed?
It might be one, two, three strikes you’re out at the old ball game. But it might be one, two, three RATE CUTS ahead at the ol’ Federal Reserve.
Too much of a stretch, you ask? Well, take a look at the MoneyShow Chart of the Day. It shows what rate futures markets are pricing in as the likeliest path for the federal funds rate through 2026.
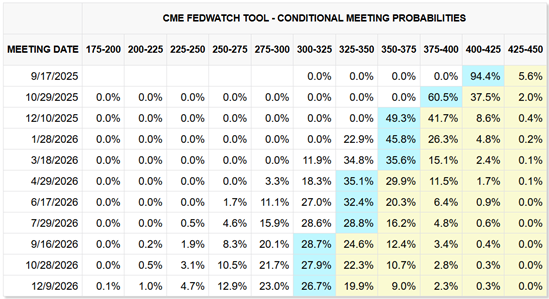
Source: CME FedWatch
Thanks to the not-so-scary July inflation figures we got yesterday, the implied probability of a Fed cut in September jumped to around 94%. That’s up sharply from just 57% a month ago.
The October meeting? Just over 60% now versus 34% a month ago. As for December? That’s about 49%. YES, it’s below the “50-50 tossup” mark. But it’s WAY higher than 25% a month ago.
What does it mean for investors and traders like you? I’ll say it until I’m blue in the face: Wall Street likes nothing MORE than cheap money.
If rates gradually come down, while growth cools without collapsing, that’s just the thing to keep stocks on the move higher. It should also help precious metals, in part because it should hurt the US dollar. Higher risk bonds would do well, and the Treasury yield curve would likely keep steepening in a modestly bullish fashion (Translation: All or most yields fall, but long-term ones fall much less than short-term ones).
Prefer thinking in fund terms? Then winners could include things like the Vanguard FTSE All-World ex-US ETF (VEU), the SPDR Gold Shares ETF (GLD), and the SPDR Bloomberg High Yield Bond ETF (JNK). If I’m right, your gains should pay for a lot of peanuts and Cracker Jacks!
If you want to get more articles and chart analysis from MoneyShow like this, subscribe to our Top Pros’ Top Picks newsletter here.